| AUTOMATIC DOCUMENTATION |
Our ability to automatically parse your source code with reference to the correct meta-model and extract technical documentation and various kinds of analysis of your code is a popular first-step for many clients. At a low cost and within a short time, it exposes you to the power of our automated tools and gives you completely up-to-date documentation of an old application, where -- typically -- documentation is either non-existent or inaccurate (which could be more dangerous than and as worthless as having no documentation).
|
| We shall even do a FREE proof-of-concept for you using your code so that you sample for yourself the value of the documentation with reference to your own source code before you buy. |
Our Methodology |
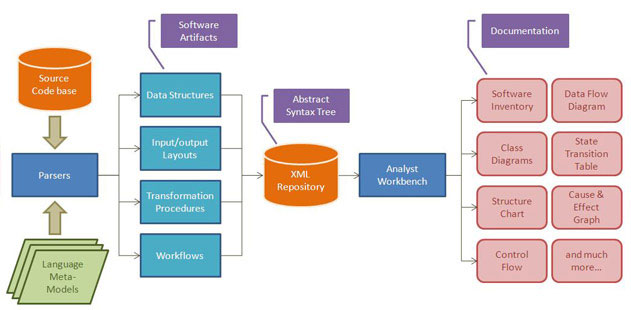
The following schematic illustrates our model-driven methodology based on OMG’s Architecture Driven Modernization standard: |
 |
Typical Documentation Output
We present the information in a set of predefined views such as the following:
|
Application Inventory: A summary of all programs, fields, files, databases, functions, subroutines, classes, and so on. |
Source View: Expanded source view with all COPY files / INCLUDE statements embedded. |
Class Diagrams: Represents relationships among the classes including methods and fields in the class for which the members are a part. The diagram’s icons are hyper-linked to the classes in the relationship. |
Dependency Graph: Showing the dependency relationship amongst paragraphs. |
Structure Chart: Showing the call relationships between paragraphs or programs and optionally, the data inputs and outputs associated with the procedure call. |
Control Flow Graph: Displays a side-by-side view of the CFG graph in the left hand side of the View Frame and the source code in the right hand side of the View Frame. |
Sequence Diagram: An UML diagram that shows the flow of control between paragraphs. |
Data Flow Diagram: Displays a graph of the flow of data and of the transformations applied to data between the data stores of a program. |
Cause & Effect Graph: Depicts a sequence of rules that govern program behavior in terms of cause and effect nodes in a directed fashion. It is isomorphic with a state transition table. |
State Transition Table: A formal description of the control conditions, actions, and state transitions of a particular procedure or of a state within a procedure. The table can be constructed for a state, a state transition, or an entire paragraph. |
State Model Graph: Displays the states and state transitions of a procedure in which states are depicted as bubbles and state transitions are depicted as arcs between the states. |
Business Rule Modeling: Displays a composite view of Structure Charts, Source Code, Class Diagrams, Control Flow Graph, and State Transition Table. |
Model Driven Analysis: Displays a composite view of Structure Charts, Source Code, Class Diagrams, State Machine Graph, and Control Flow Graph. |
OOA/OOD View: Displays a composite view of Structure Charts, Source Code, Class Diagrams, State Machine Graph, Data Flow Diagram, and State Transition Table. |
Structured Systems Analysis / Structured Design Method View: Displays a composite view of Structure Charts, Source Code, Class Diagrams, Data Flow Diagram, and Control Flow Graph. |
State Machine Model: Represents the behavior of a system that is composed of a finite number of states and displays an aggregate view of the other views: State Transition Table, State Model Graph, Cause & Effect Graph, CFG and Source View. |
Dead Code: Code segments that are never executed. |
Duplicate Code: Code segments that are duplicate. |
Unreferenced Variable Index:List of unreferenced variables
|
| A few samples are enclosed below to give you an idea of what these look like. |
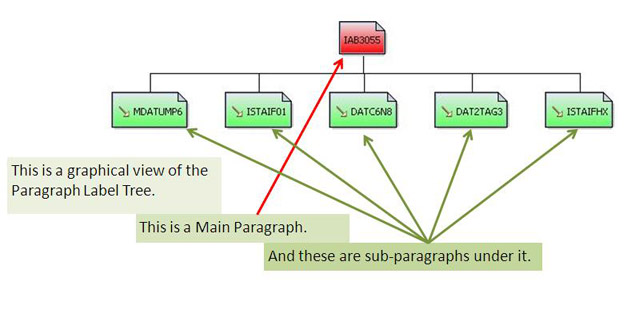
The diagram below is a DEPENDENCY GRAPH:
|
 |
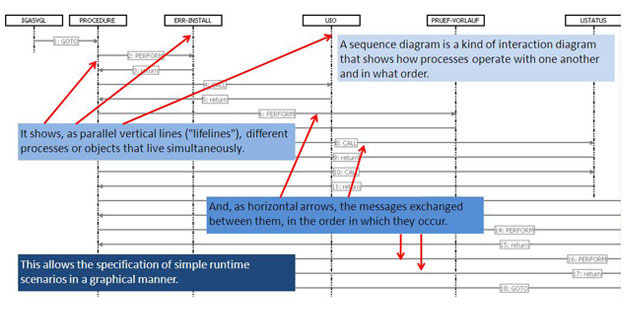
The diagram below is a SEQUENCE DIAGRAM: |
 |
| |